The State of Token Health: Q3 2026
54 tokens, 1,385 scans, real data. Development and Community are the weakest dimensions tracked. Security is bimodal, not average. Here's what we found.
I scan tokens for a living, so I pulled every score Token Health Scan has generated and looked at what the data actually says about the state of the market. Fifty-four tokens tracked, 1,385 scored scans since May 2025. The average composite health score right now is 55 out of 100.
That number alone doesn't tell the story. The story is in the five dimensions, and two of them are dragging almost everything down.
The headline numbers
Across the 54 tokens Token Health Scan tracks as of August 2026:
- Average composite score: 55/100 (median 55, range 35 to 77)
- Security averages 73/100, but the distribution is bimodal. 67% of tokens score 70 or above. 33% score below 40. Nothing sits in the middle.
- Development averages 39/100, the weakest dimension by a wide margin. 69% of tokens score below 40.
- Community averages 40/100. Not a single tracked token scores 70 or above on this dimension.
- 61% of tokens carry a live, unrestricted mint function according to their security writeups, meaning the contract can issue new supply with no cap the score can verify.
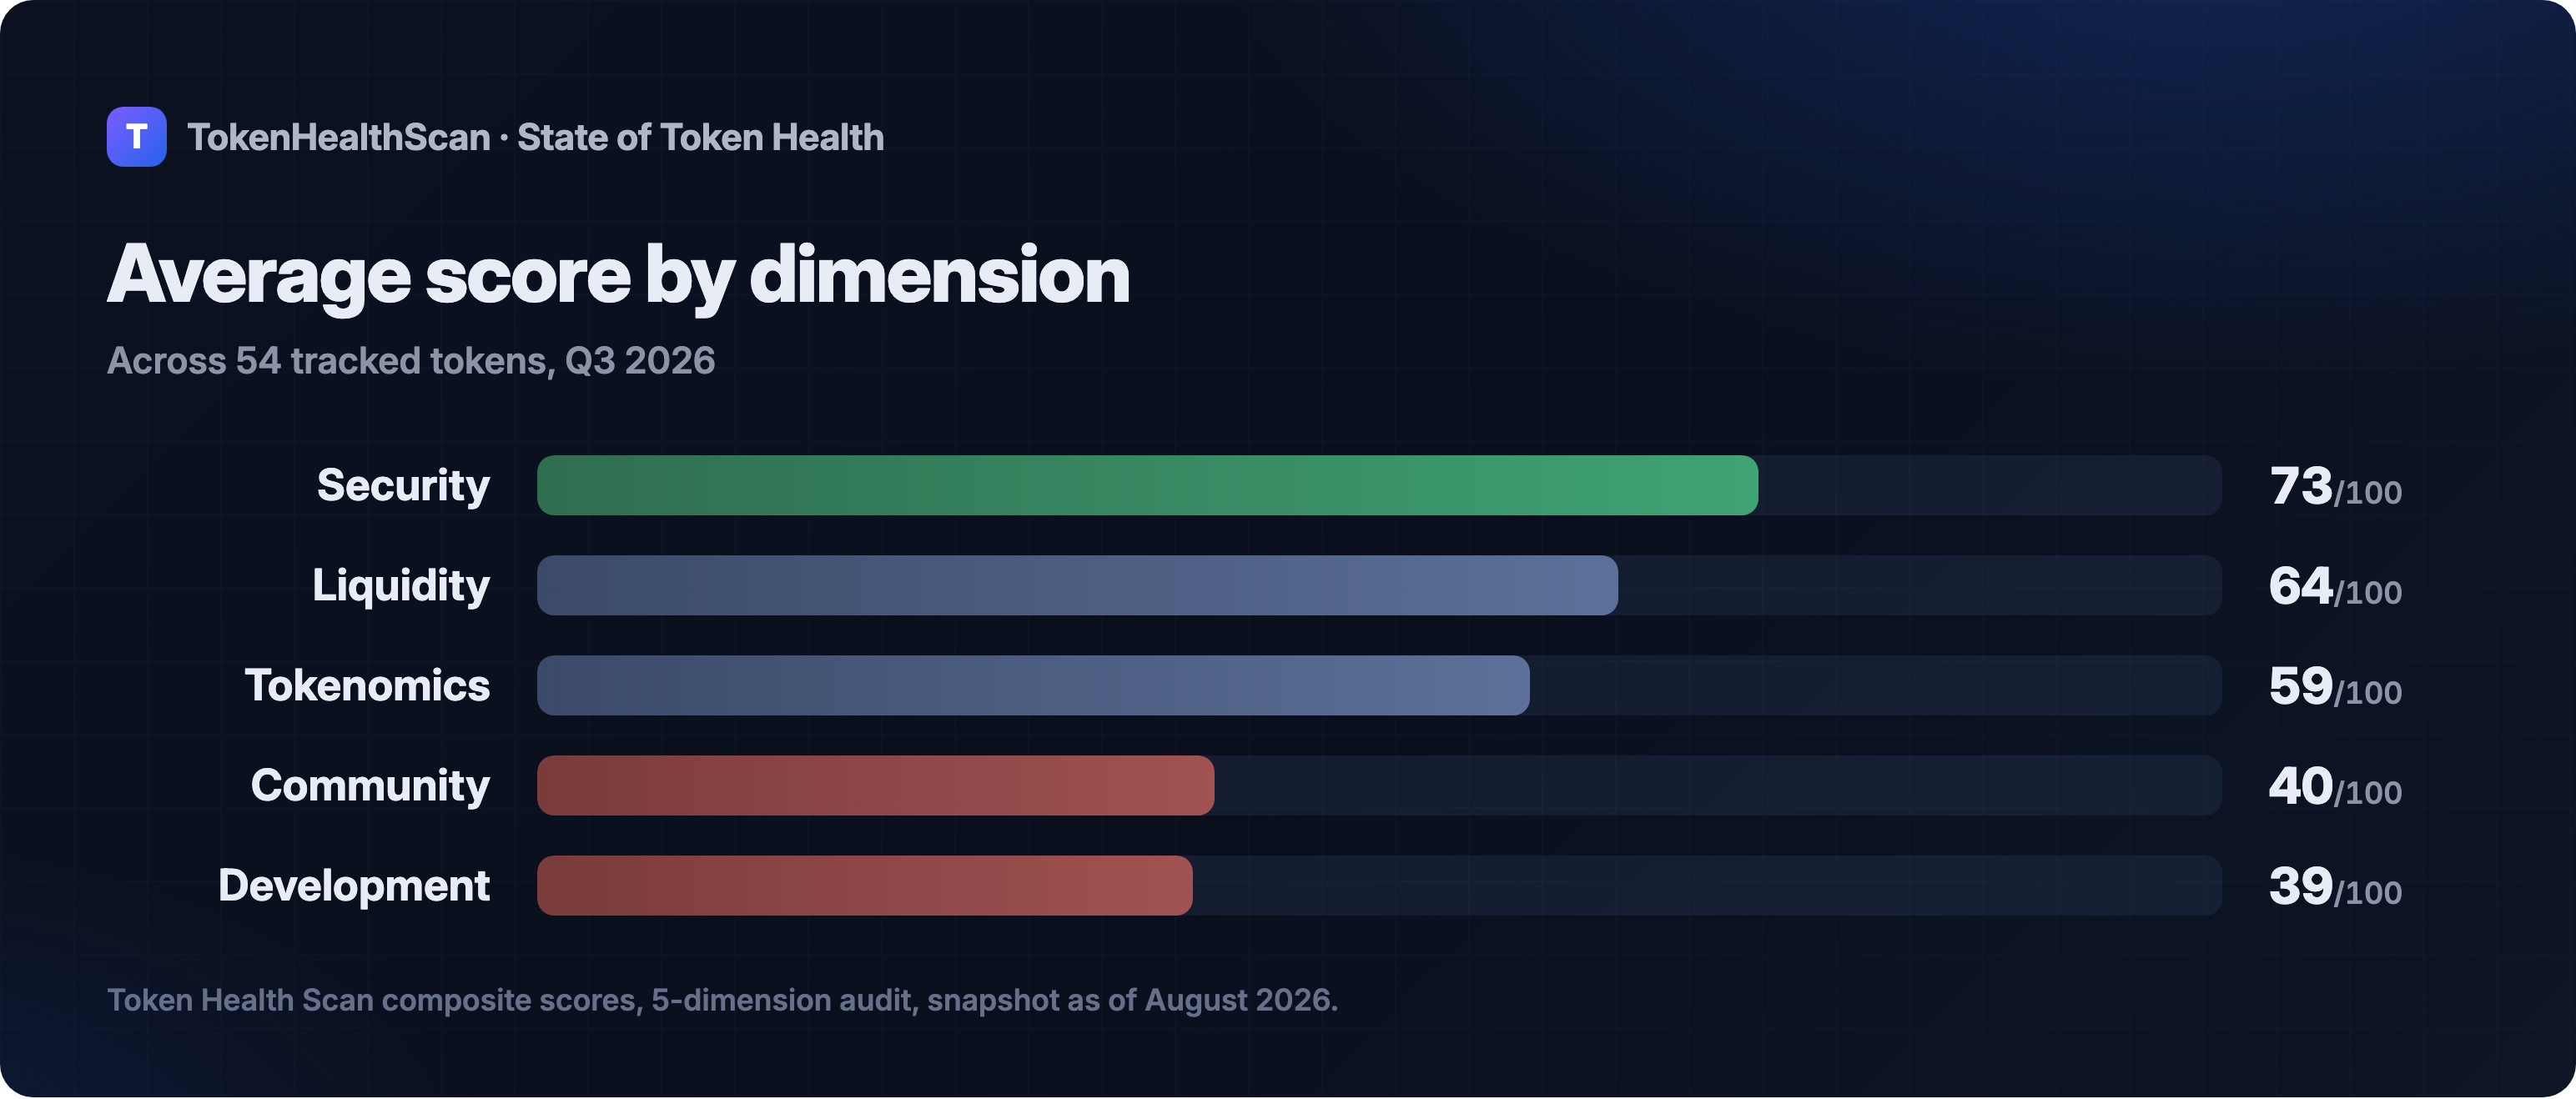
Security and Liquidity are the dimensions teams actively manage before launch. Community and Development are the ones nobody audits until something breaks. The data reflects that gap directly.
Security is bimodal, not average
A 73 average sounds reassuring until you see the shape of the distribution. Security in this dataset is not a bell curve. It's two clusters. Tokens that pass the basic checks (verified contract, renounced ownership, no honeypot flags) score 70-100. Tokens that fail one or more of those checks score 30 or below. Almost nothing scores in between.
Three tokens tied for the lowest Security score in the tracked set, all at 30: ONDO, KAITO, SYRUP. Three tied for the highest, all at 100: PYTH, USD1, CHZ.
The practical read: Security is close to a pass/fail signal in this dataset, not a graded one. A token in the 30s isn't "somewhat insecure." It's failing a specific, nameable check, usually mint authority, contract verification, or honeypot status.
Development and Community: nobody is doing well
Development is the weakest dimension across the entire tracked set. 69% of tokens score below 40. The worst three, all at 25: ZRO, AITECH, ASTER. The best three: LDO and LINK at 100, STRK at 92, all projects with large, active open-source teams and long commit histories, exactly what the dimension is built to reward.
Community tells a similar story from a different angle. Not one token in the tracked set scores 70 or above. The best three, ARB and PEPE at 69, BONK at 67, are close but don't clear the bar. The worst three, all at 5: SEI, BGB, PUMP.
Neither of these dimensions is hard to improve. Development scoring rewards visible GitHub activity: contributors, commit frequency, public repos. Community scoring rewards verifiable social presence: Telegram size, Twitter following, Discord activity. Most tracked tokens simply aren't investing there, or aren't making the investment visible to the signals the score reads.
Where the composite score comes from
| Dimension | Average | Median | Lowest 3 | Highest 3 |
|---|---|---|---|---|
| Security | 73 | 86 | ONDO, KAITO, SYRUP (30) | PYTH, USD1, CHZ (100) |
| Liquidity | 64 | 65 | AITECH, OM (30), SKL (40) | TRUMP, HTX, WLFI (75) |
| Tokenomics | 59 | 58 | IQ (46), ASTER, SEI (49) | PYTH, TRUMP, BONK (90) |
| Community | 40 | 44 | SEI, BGB, PUMP (5) | ARB, PEPE (69), BONK (67) |
| Development | 39 | 25 | ZRO, AITECH, ASTER (25) | LDO, LINK (100), STRK (92) |
The five lowest composite scores in the tracked set: BGB (35), KAITO (39), OM (40), AVNT (41), IQ (42). Each is dragged down by a different combination of dimensions, not one universal cause.
The five highest: LDO (77), JUP and ARB (74), PYTH and BONK (69). Notably, none of these break 70 on Community. On Tokenomics, JUP, PYTH, and BONK all score 90, while LDO and ARB sit in the low 60s. Even the healthiest tokens in this dataset aren't strong everywhere. They're strong enough everywhere, with one or two standout dimensions carrying the composite.
The full ranked list, color-coded and linked to each token's live report, is further down this page.
The trend: scores are up from a year ago, and have leveled off
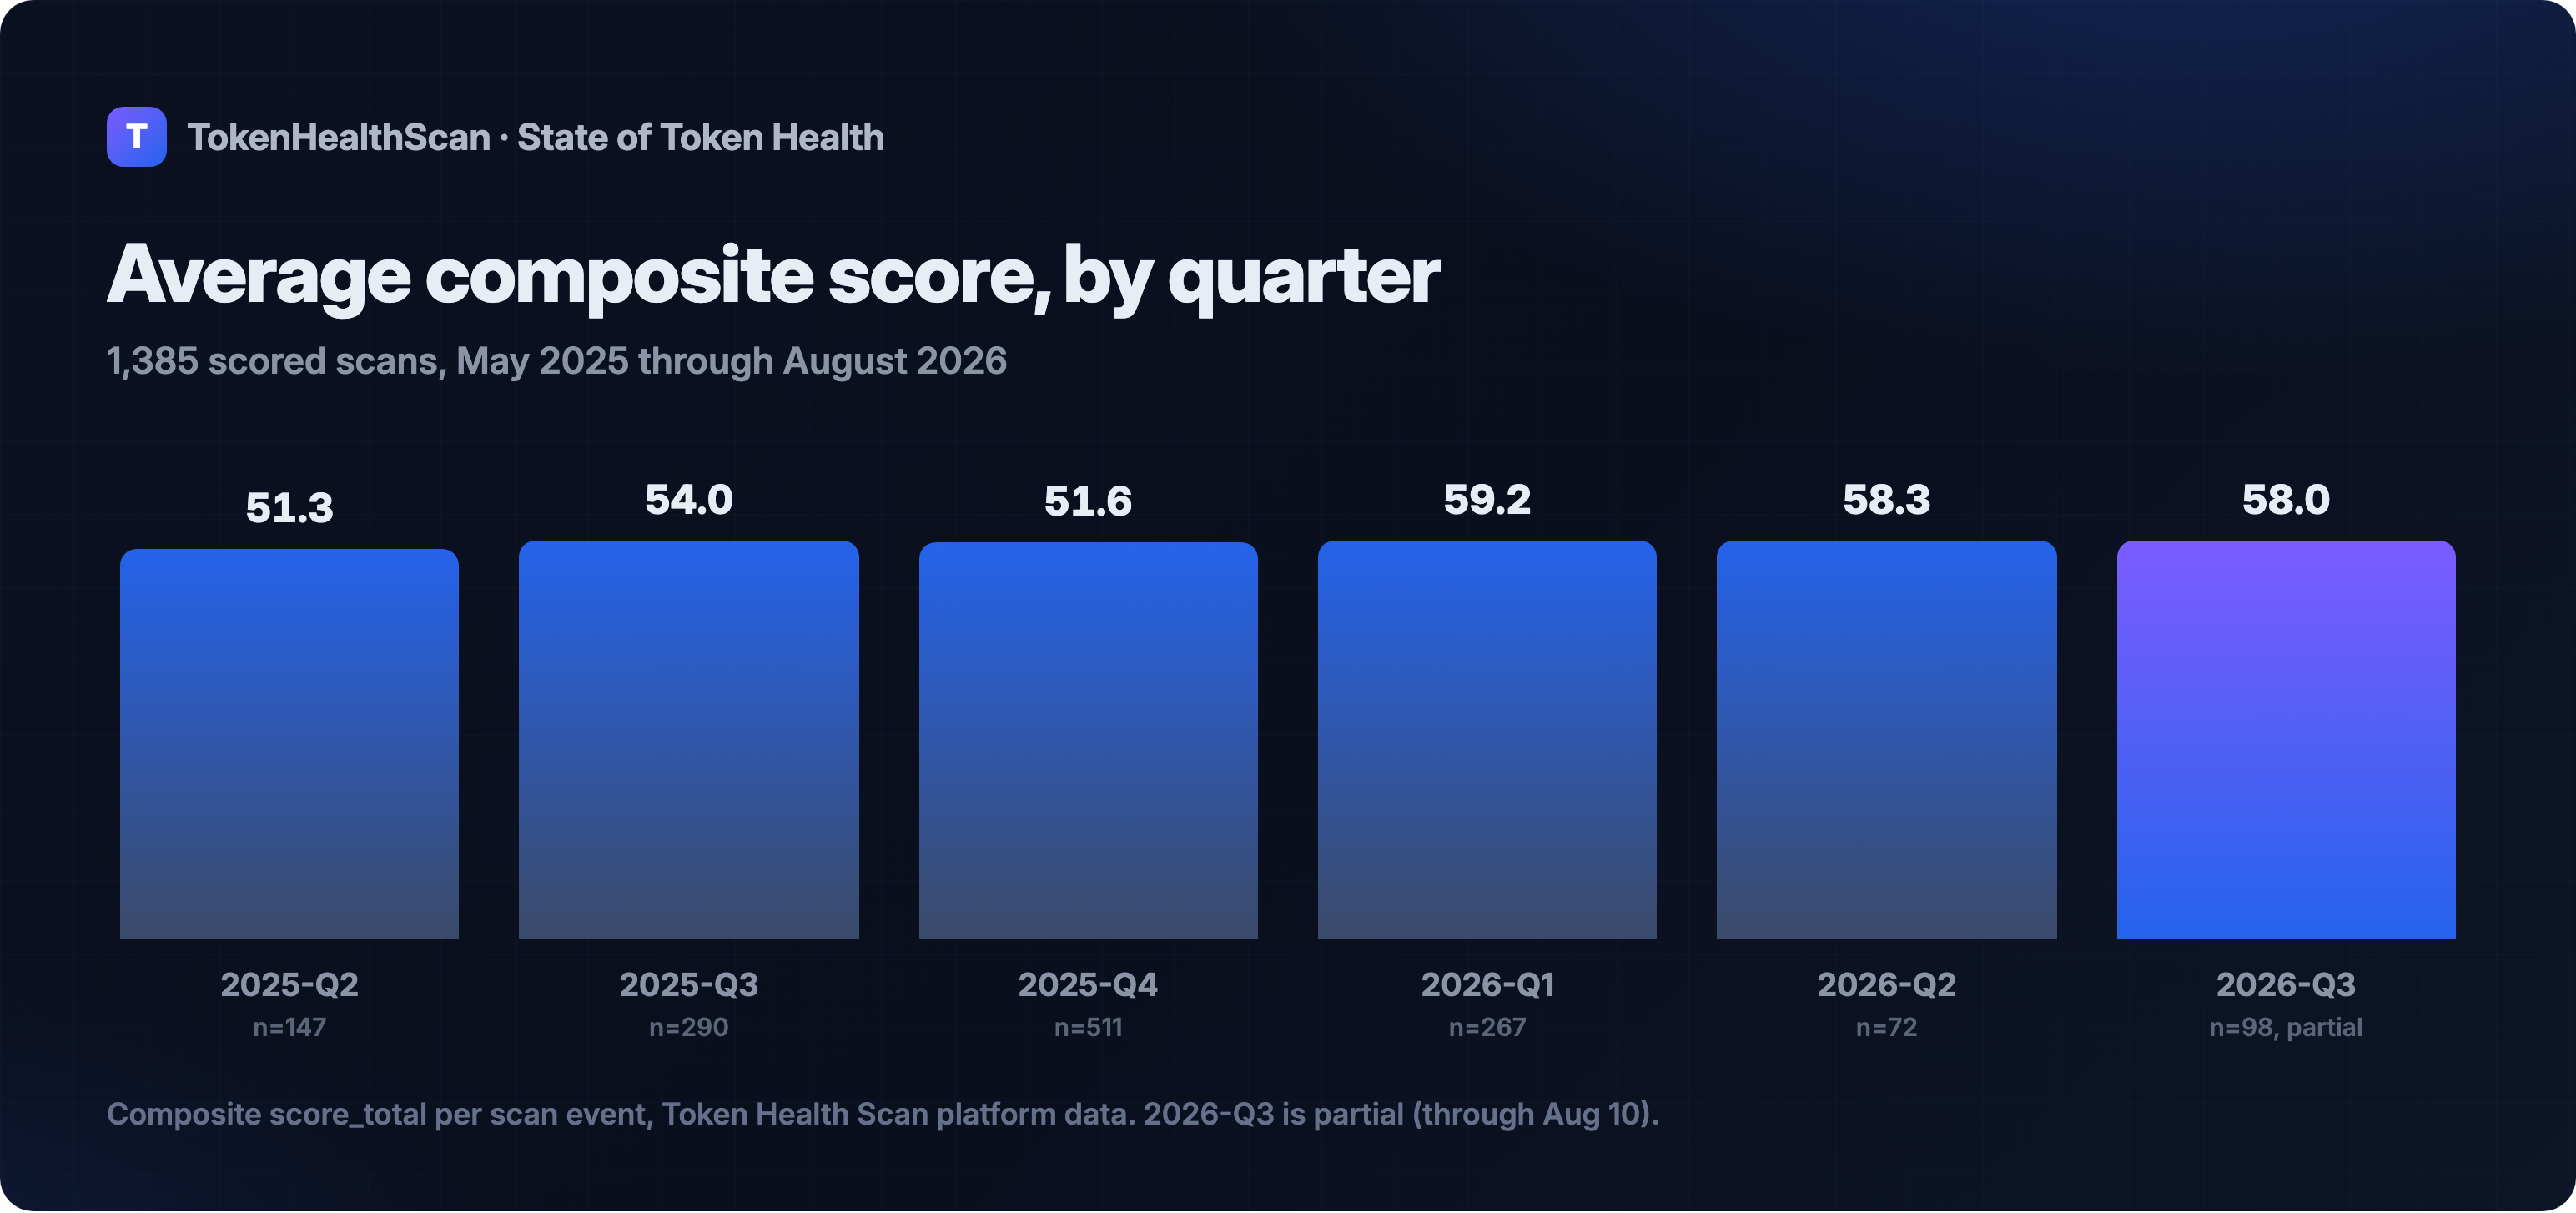
The average composite score across every scan Token Health Scan has run, not just the 54 currently-tracked tokens, moved from 51.3 in Q2 2025 to 58.0 in the current quarter. That's a real, if modest, improvement of about 13% over five quarters. Most of the gain happened between Q4 2025 (51.6) and Q1 2026 (59.2). Since then, the average has held flat in the 58-59 range for three straight quarters.
I can't fully separate two effects driving that jump: the tokens people are choosing to scan improving in quality, versus underlying token quality genuinely improving market-wide. Both are plausible. What the data supports directly is that the composite average is meaningfully higher now than it was a year ago, and that the improvement has stalled rather than continued.
This tracks with what I found writing the monthly DeFi exploit reviews. May's exploits, June's, and July's all point to the same recurring failure classes: governance concentration, bridge and oracle key compromise, and admin-key architecture that passed a code audit but never checked who actually holds the keys. July alone accounted for over $200M in losses, several of them repeat exploits of previously-flagged vulnerabilities. A composite score plateauing at 58 while these patterns keep recurring is consistent, not contradictory. The score is catching more of what teams control, contract-level security. It's catching less of what they don't fully own yet: operational key management, governance design.
Methodology and honest limitations
Every score cited here comes directly from Token Health Scan's own database, pulled and computed on August 10, 2026. Full scoring methodology, including exactly what each dimension checks and which on-chain and off-chain sources feed it: How Token Health Scan Scores a Protocol.
Sample composition. The 54 currently-tracked tokens skew Ethereum-heavy: 39 on Ethereum, 5 on BSC, 5 on Solana, 4 on Base, 1 on Arbitrum. Token Health Scan officially supports five chains (Ethereum, Base, Arbitrum, Solana, Polygon); the BSC entries predate that decision and Polygon has zero representation in the current tracked set. Read the dimension averages as a description of this specific 54-token sample, not a claim about the entire token market.
What the trend does and doesn't show. The quarterly trend line is built from all 1,385 scored scan events, not just the current 54 tracked tokens, so it reflects broader platform usage over time. What it can't yet show is a per-dimension trend. Token Health Scan retains the current dimension breakdown per token but not historical dimension scores, only historical composite scores. I've flagged this internally as a gap worth closing so next year's edition can say whether Development is improving or Security is declining, specifically, not just whether the composite is moving.
Data quality note. A small number of tracked tokens show internal inconsistencies in their raw on-chain data, most commonly a token contract's total supply reported at an implausible order of magnitude (a likely decimal-place artifact) or a GitHub last-commit date that postdates the scan itself. These don't materially change the dimension scores discussed above, but they're a reminder that on-chain and off-chain data sources aren't always clean, and a good scoring system has to be honest about what it can't fully verify rather than smoothing it over.
Frequently Asked Questions
How many tokens does this report cover?
54 tokens with a current, complete 5-dimension score as of August 10, 2026, plus a broader trend line built from 1,385 total scored scans since May 2025. The 54-token sample skews toward Ethereum (39 of 54).
Why is the average Security score so much higher than Development or Community?
Security scoring checks binary, verifiable facts: is the contract verified, is ownership renounced, is there a honeypot pattern. Most tracked tokens either pass or fail these checks cleanly, producing the bimodal high-or-low pattern. Development and Community scoring reward ongoing, visible investment (commit activity, social growth), which most tracked tokens simply haven't made a priority, or haven't made visible to the data sources the score reads.
Does a low Development or Community score mean a token is unsafe?
Not on its own. Security is the dimension most directly tied to exploit risk. A weak Development or Community score signals a different kind of risk: thin ongoing support and low organic adoption, which matters for long-term viability rather than immediate exploit exposure. Read all five dimensions together, not one in isolation.
Is the composite score trend showing the market getting healthier?
The average composite score is higher now (58 in Q3 2026) than a year ago (51 in Q2 2025), and that's a real, data-backed statement. Whether that reflects the overall market improving, or reflects a change in which tokens people choose to scan, isn't something this data can fully separate. Both plausibly play a role.
Will this report run again?
Yes, quarterly. Each edition will use the same methodology on the then-current tracked set, so the numbers are comparable quarter to quarter.
Every token in the tracked set (54, sorted by composite score)
Red = below 40. Green = 70 or above. Unmarked = 40–69.
| Token | Chain | Composite | Security | Liquidity | Tokenomics | Community | Development |
|---|---|---|---|---|---|---|---|
| LDO | Ethereum | 77 | 100 | 65 | 64 | 55 | 100 |
| ARB | Arbitrum | 74 | 100 | 75 | 61 | 69 | 65 |
| JUP | Solana | 74 | 100 | 70 | 90 | 57 | 53 |
| BONK | Solana | 69 | 100 | 65 | 90 | 67 | 25 |
| PYTH | Solana | 69 | 100 | 60 | 90 | 59 | 37 |
| PEPE | Ethereum | 68 | 100 | 75 | 69 | 69 | 25 |
| LINK | Ethereum | 64 | 30 | 75 | 69 | 44 | 100 |
| FRAX | Ethereum | 64 | 86 | 75 | 49 | 47 | 61 |
| CRV | Ethereum | 64 | 86 | 75 | 64 | 58 | 39 |
| CRO | Ethereum | 63 | 86 | 65 | 49 | 51 | 65 |
| STRK | Ethereum | 63 | 86 | 55 | 59 | 23 | 92 |
| WLD | Ethereum | 62 | 100 | 65 | 59 | 63 | 25 |
| TRUMP | Solana | 62 | 100 | 75 | 90 | 22 | 25 |
| PENDLE | Ethereum | 61 | 86 | 65 | 56 | 44 | 56 |
| FET | Ethereum | 61 | 86 | 75 | 64 | 31 | 50 |
| NEXO | Ethereum | 61 | 100 | 75 | 49 | 47 | 34 |
| PUMP | Solana | 59 | 100 | 75 | 90 | 5 | 25 |
| MORPHO | Ethereum | 59 | 30 | 65 | 61 | 52 | 85 |
| VIRTUAL | Base | 57 | 86 | 65 | 64 | 44 | 25 |
| USD1 | Ethereum | 57 | 100 | 65 | 49 | 47 | 25 |
| ZRO | Ethereum | 56 | 100 | 55 | 69 | 32 | 25 |
| SKL | Ethereum | 56 | 86 | 40 | 64 | 55 | 37 |
| USDE | Ethereum | 56 | 86 | 75 | 49 | 44 | 25 |
| ETHFI | Ethereum | 56 | 100 | 65 | 56 | 32 | 25 |
| CHZ | Ethereum | 56 | 100 | 50 | 59 | 44 | 25 |
| ASTER | BSC | 55 | 100 | 65 | 49 | 38 | 25 |
| ATH | Ethereum | 55 | 86 | 55 | 59 | 52 | 25 |
| ICP | Ethereum | 55 | 100 | 65 | 64 | 22 | 25 |
| GHO | Ethereum | 54 | 86 | 75 | 49 | 14 | 46 |
| HTX | Ethereum | 54 | 86 | 75 | 49 | 35 | 25 |
| OKB | Ethereum | 53 | 100 | 55 | 59 | 25 | 25 |
| CAKE | BSC | 53 | 30 | 75 | 49 | 65 | 45 |
| AAVE | Ethereum | 52 | 30 | 75 | 64 | 61 | 32 |
| MNT | Ethereum | 52 | 30 | 75 | 49 | 52 | 53 |
| SYRUP | Ethereum | 51 | 30 | 75 | 61 | 42 | 47 |
| LEO | Ethereum | 51 | 86 | 50 | 49 | 44 | 25 |
| SKY | Ethereum | 51 | 86 | 75 | 49 | 22 | 25 |
| ONDO | Ethereum | 49 | 30 | 65 | 59 | 55 | 34 |
| USDY | Ethereum | 49 | 100 | 55 | 49 | 18 | 25 |
| GT | Ethereum | 49 | 86 | 50 | 49 | 25 | 37 |
| WLFI | Ethereum | 49 | 30 | 75 | 56 | 57 | 25 |
| SEI | Ethereum | 48 | 100 | 60 | 49 | 5 | 25 |
| ENA | Ethereum | 48 | 30 | 65 | 64 | 54 | 25 |
| POL | Ethereum | 48 | 86 | 55 | 59 | 9 | 33 |
| AERO | Base | 47 | 30 | 75 | 59 | 45 | 25 |
| API3 | Ethereum | 46 | 30 | 55 | 56 | 9 | 80 |
| AITECH | BSC | 45 | 100 | 30 | 53 | 16 | 25 |
| RNDR | Ethereum | 45 | 30 | 65 | 49 | 54 | 25 |
| COAI | BSC | 43 | 30 | 65 | 49 | 44 | 25 |
| IQ | Ethereum | 42 | 30 | 65 | 46 | 26 | 41 |
| AVNT | Base | 41 | 30 | 55 | 49 | 45 | 25 |
| OM | BSC | 40 | 30 | 30 | 53 | 35 | 51 |
| KAITO | Base | 39 | 30 | 55 | 49 | 38 | 25 |
| BGB | Ethereum | 35 | 30 | 65 | 49 | 5 | 25 |
Scores move daily as the underlying on-chain and off-chain signals change. This table is a snapshot as of August 10, 2026. Run any token above through the live scanner for its current number.
See the Output for Yourself
Every score cited in this report is a live, re-scannable number. Run any of these yourself to see the current dimension breakdown behind the composite.
- LDO: the highest composite score in the tracked set (77), carried by perfect Security and Development scores.
- BGB: the lowest composite score in the tracked set (35), with a 5/100 Community score.
- PEPE: a composite of 68, near the top of the tracked range, driven partly by a Community score of 69, tied for the best in the dataset.
Explore the Cluster
- Best Token Scanners in 2026: How Token Health Scan compares to the other 6 tools in this category.
- How Token Health Scan Scores a Protocol: The full 5-dimension methodology behind every number in this report.
- 11 DeFi Exploits in July 2026: The failure patterns behind the trend section above.
References
- Token Health Scan platform data (token_reports, token_scans), pulled 2026-08-10.
- Token Health Scan — https://tokenhealthscan.com
*Data pulled directly from Token Health Scan's own database on August 10, 2026. This is the first edition of a planned quarterly series.*